

What is the Aurora?
Aurora is the name given to the glow or light produced when electrons from space flow down Earth’s magnetic field and collide with atoms and molecules of the upper atmosphere in a ring or oval centered on the magnetic pole of Earth. The collisions produce light much like how electrons flowing through gas in a neon light collide with neon and other gasses to produce different colored light bulbs.
The Aurora is also called the Northern Lights in the northern hemisphere and Southern Lights in the southern hemisphere. The technical term for the Northern Lights is Aurora Borealis and the Southern lights are called the Aurora Australis. The word Aurora was first used by Galileo and comes from Latin and is the name of the goddess of dawn. The word Borealis comes from the Latin word boreal which means “northern” or “from the north”. The word Australis is Latin for austral, which means “southern.”
What Causes the Aurora?
The aurora is formed from interactions between the solar wind streaming out from the sun and Earth’s protective magnetic field, or magnetosphere. The aurora is one manifestation of geomagnetic activity or geomagnetic storms. As the solar wind increases in speed and the interplanetary magnetic field embedded in the solar wind turns southward, the geomagnetic activity will increase and the aurora will become brighter, more active, and move further from the poles. Even moderate solar wind creates aurora so there is usually a weak aurora somewhere even when there isn’t a big geomagnetic storm.
There are two types of solar events that create big geomagnetic storms that are associated with bright and active aurora. The first is a Coronal Mass Ejection, or CME, which can be described as a billion tons of plasma ejected from the sun, traveling at a million miles per hour. When a CME arrives at Earth, it can produce some of the biggest geomagnetic storms and thus, some of the brightest and most active auroras that extend furthest toward the equator. The second solar event that can create moderate sized geomagnetic storms is called a coronal hole. Coronal holes are the source of high speed solar wind streams. When these high speed streams arrive at Earth, they can produce active auroras. But the geomagnetic storms and aurora associated with coronal holes is less active than those from the biggest and fastest CME's.
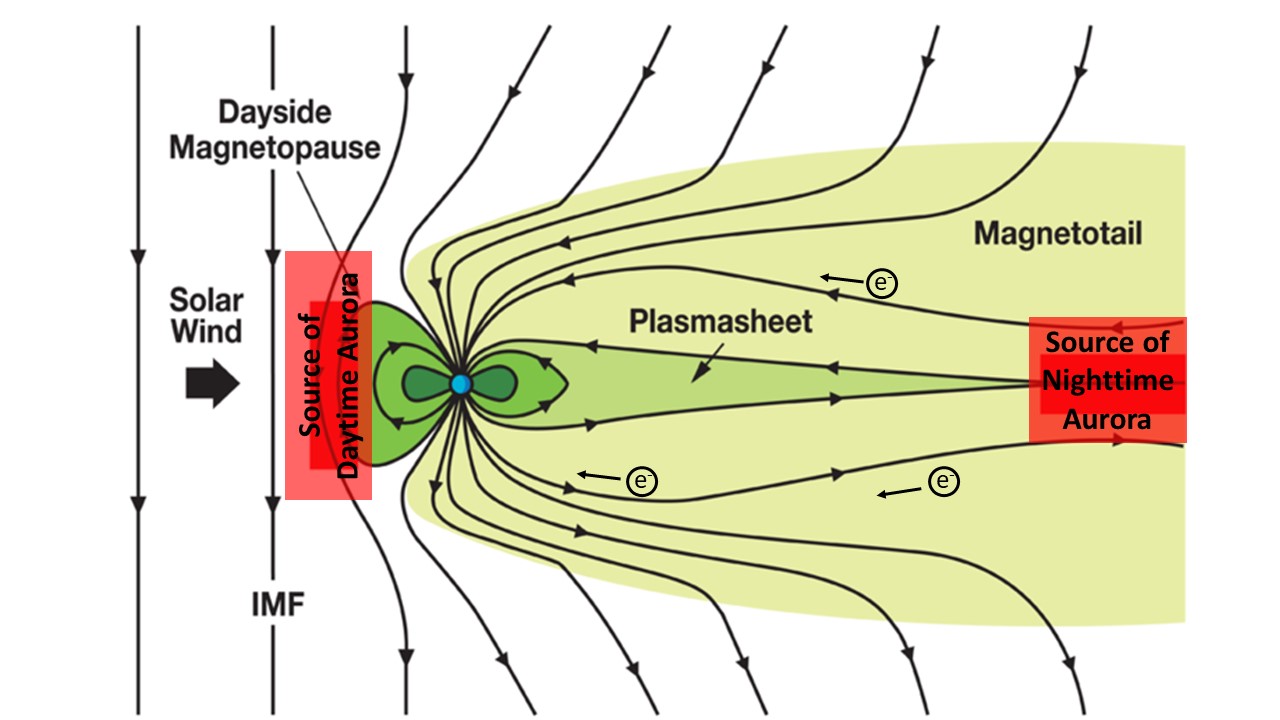
One subtle note about the source of the auroral electrons. It is technically not the solar wind electrons that create aurora. When the solar wind is strong and the embedded Interplanetary Magnetic Field (IMF) is aligned opposite Earth’s magnetic field (southward), then there is a transfer of more solar wind energy into the magnetosphere which accelerates more of the magnetospheric electrons down the magnetic field towards Earth. Thus, the auroral electrons come from within Earth’s magnetic magnetosphere. The auroral electrons that create the best aurora in the middle of the night actually come from the tail of the magnetosphere, downstream (away from the sun)
The figure below shows the magnetosphere and the locations where electrons are accelerated (in red). The red region on the right of the figure is where the electrons that produce night-time aurora are accelerated and the source of the processes that generate geomagnetic storms.
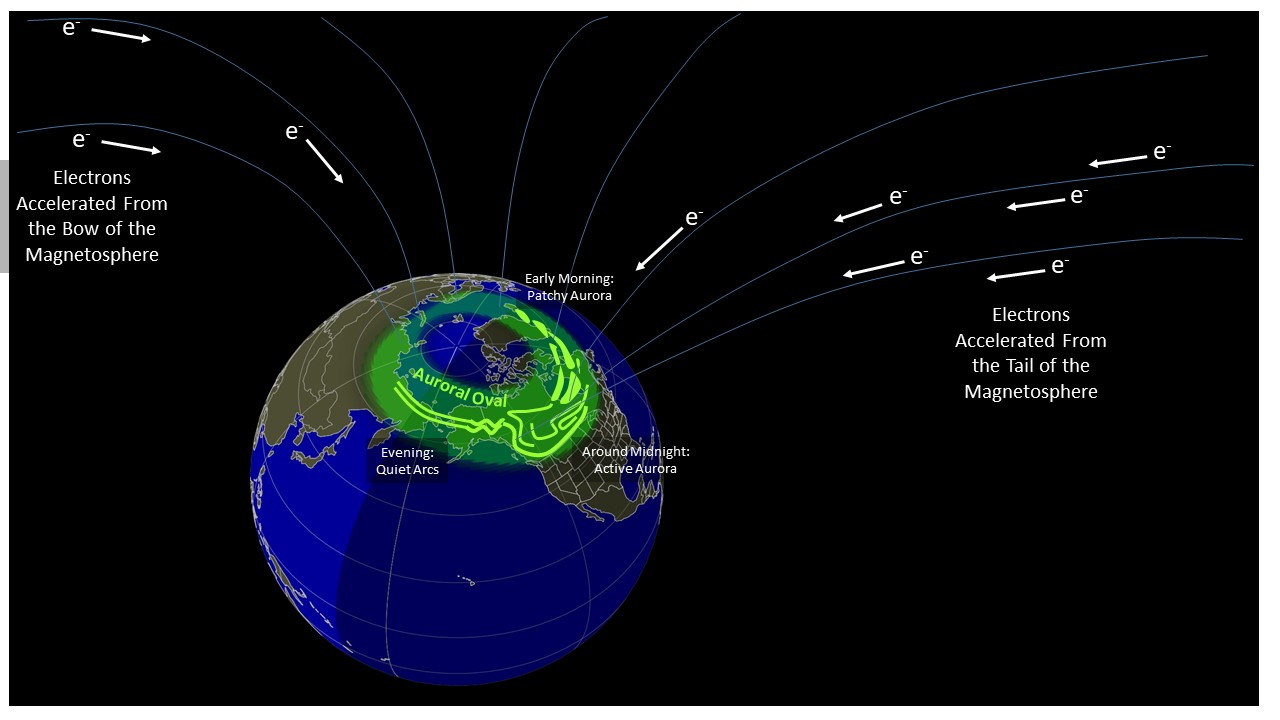
The accelerated electrons follow Earth’s magnetic field lines towards the north and south magnetic poles where they bombard the upper atmosphere and create the aurora. These acceleration regions map down Earth’s magnetic field lines to form an oval of aurora centered on the magnetic poles.
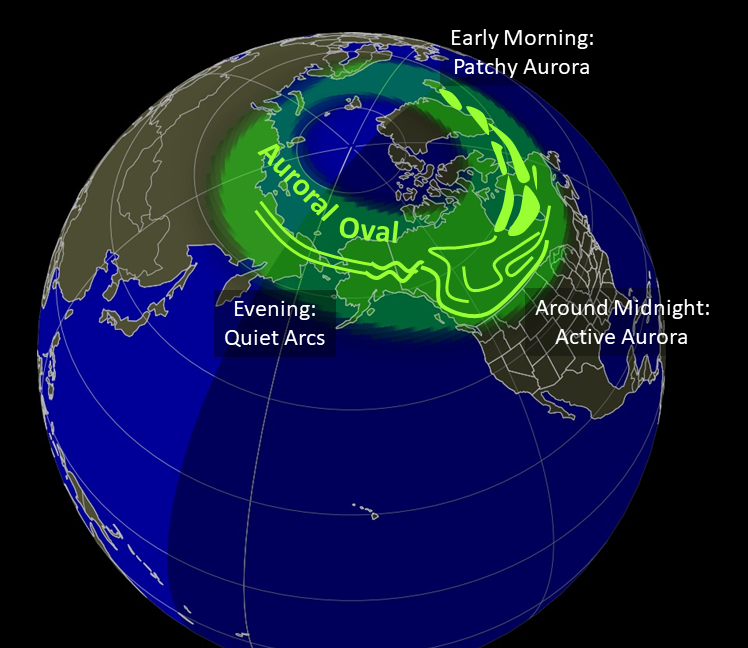
The figure below shows Earth with its magnetic field lines and the electrons traveling down the field lines to the upper atmosphere. The green shaded area shows the general shape of the auroral oval centered on the magnetic pole. The brighter green features show the typical shapes of the aurora in different parts of the auroral oval.
When the fast moving electrons, traveling nearly 1/10th the speed of light (20,000 km/sec or 44 million mph), collide with the atoms and molecules in Earth’s upper atmosphere (above 100 km or 60 miles) they transfer energy to the atmosphere which “excites” the atom or molecule to higher energy states. As the atoms and molecules relax back to their natural energy level, they release photons. These photons are what we see as aurora. This process is similar to the process that occurs in a neon or fluorescent light.
Geomagnetic Activity and Aurora:
The aurora is one manifestation of geomagnetic activity. The electrons that create the aurora also carry electric currents that are conducted through the ionized portion of the upper atmosphere (the ionosphere). These currents generate perturbations or changes in the magnetic field at the surface of Earth. The changes in the apparent magnetic field of Earth (the geomagnetic field) are measured and are the basis for the creation of geomagnetic disturbance indices such as the Planetary K index, or Kp.
In this way, the geomagnetic index, Kp, is a very good indicator of aurora. The location and the brightness of the aurora are directly correlated with Kp. When the Kp index is high (between 7 and 9), the aurora will be bright and the auroral oval will move to lower latitudes. When the Kp index is moderate (5 or 6), the aurora will retreat towards the poles and be less bright and a little less active. It should be noted however that even lower levels of geomagnetic activity (Kp of 3 or 4) can result in nice aurora with reasonable brightness and activity. The auroral is just going to be closer to the magnetic poles as the auroral oval contracts.
Colors of the Aurora:
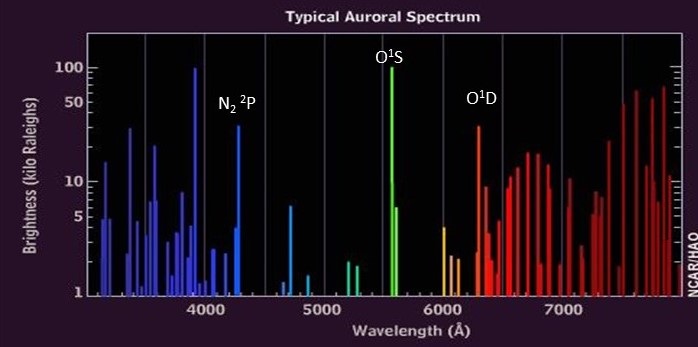
The different colors of the aurora are produced when different atmospheric atoms and molecules are excited to various energy levels. The most common auroral color is a pale green color at a wavelength of 557.7 nm. This is the result of atomic oxygen having been excited to the 1S, or singlet S, state. Another less common color is a deep red which is the result of atomic oxygen having been excited to the 1D, or singlet D, state. Other colors come from other molecules such as nitrogen.
The figure below shows a typical spectrum of aurora.
Different auroral colors come from different heights in the atmosphere primarily because the life-time of an excited atom or molecule (time spent in its excited state) is vastly different for different colors of the aurora. The green aurora from oxygen in the 1S state typically occurs from 120 to 400 km (80 to 250 miles) above the surface of Earth. The red aurora from oxygen in the 1D state is restricted to altitudes above 300 km (180 miles). This is because oxygen in the 1D state has a very long lifetime (>150 sec) and can only survive in the thinner atmosphere above 300 km. At lower altitudes the oxygen in the 1D state collides with other atmospheric atoms or molecules before it can emit a photon which deactivates or quenches the excited oxygen. The 1S state of oxygen has a lifetime of about 1 second and therefore emits a photon more quickly and thus can emit at lower altitudes where the density is higher. The aurora sometimes has a purplish lower border which comes from emissions from molecular nitrogen. This "prompt" emission is emitted from excited states of nitrogen that have almost no delay between excitation and emission. It survives at even lower altitudes between 120 and 200 km (80 to 120 miles). In the video sequence at the end of this readme document, the purple emissions from the nitrogen seems to lead the green emissions from the oxygen. This is an example of the difference between the prompt emission of nitrogen vs the emission from the longer-lived excited state of oxygen.
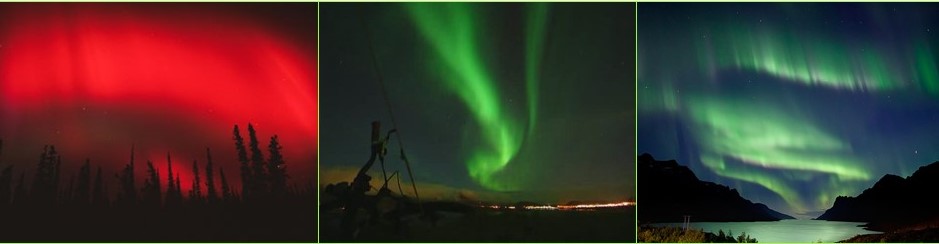
The figure below shows different colors of aurora. The left panel shows a red aurora. The middle panel shows the most common green aurora. The right panel shows green aurora with purple lower edges.
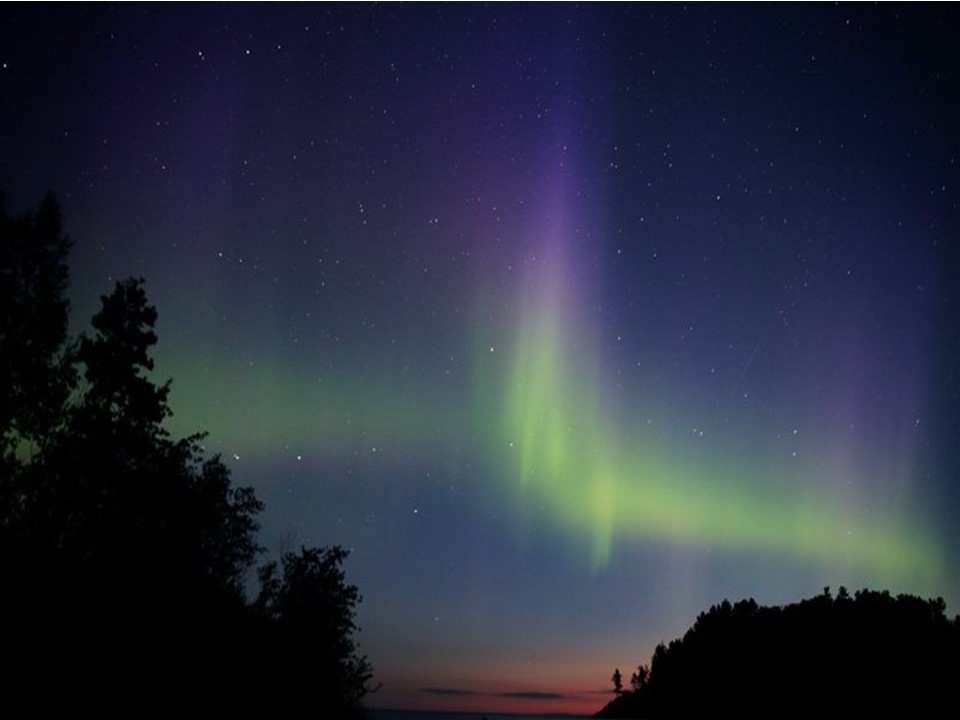
One particular aurora color is the result of excited nitrogen being further excited by photons from the sun, or sunlight. This "sunlit aurora" typically occurs near sunrise or sunset and can be seen as a purplish color at the top of the auroral rays as seen in the figure below.
Often, people report that the aurora is pale white in color. This is not true. These reports are in fact a manifestation of human’s night vision where the eye first picks out brightness without distinguishing color. Only when the aurora is fairly bright, can the human eye distinguish the true green, red, and other colors.
It should also be noted that modern digital cameras are often more sensitive than the human eye and can detect aurora and the the colors of the aurora when it is too dim for humans to see it.
Shapes and Morphology of the Aurora:
The Aurora Borealis and Aurora Australis are mirror images of each other. When the aurora becomes active in one hemisphere, it will become active in the other at the same time. Auroral activity, as measured by brightness, complexity of the formations, and location, is directly correlated with geomagnetic activity.
Aurora exists nearly all the time. It can be seen somewhere on Earth nearly every night of the year. Quiet aurora consists of simple arcs running east-west across the sky at very high latitudes. During geomagnetically quiet times, the auroral ovals (northern and southern) stay close to the north and south magnetic poles. As geomagnetic activity increases, the aurora becomes brighter and more active. The active auroral often splits into multiple arcs and develops waves that seem to propagate along the arcs. When geomagnetic activity increases further, the aurora develops great curls and waves that can fill the entire sky and can move from one horizon to the other in a few tens of seconds. The active auroral oval expands even further from the poles. During very active times the auroral oval can expand down to latitudes where aurora is rarely seen such as the northern half of the United States and Europe.
The figure below shows the different phases of aurora over the course of a typical night for moderate levels of geomagnetic activity (Kp = 4 to 7). The evening and morning aurora are typically less active and less interesting to observe. The aurora near midnight is most active and brightest.
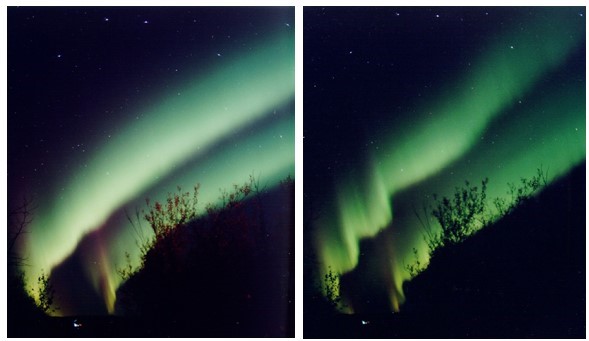
- Evening: The aurora can be seen shortly after sunset as a single arc spanning east-west from horizon to horizon. Sometimes there are several parallel arcs. Often the arcs will appear as bundles of tall rays of aurora making the arc appear as a hanging curtain. The latitude of the evening arcs depends on the level of geomagnetic activity. At higher levels of the geomagnetic index, Kp, the aurora moves equatorward.
The figure below shows a pair of quiet auroral arcs.
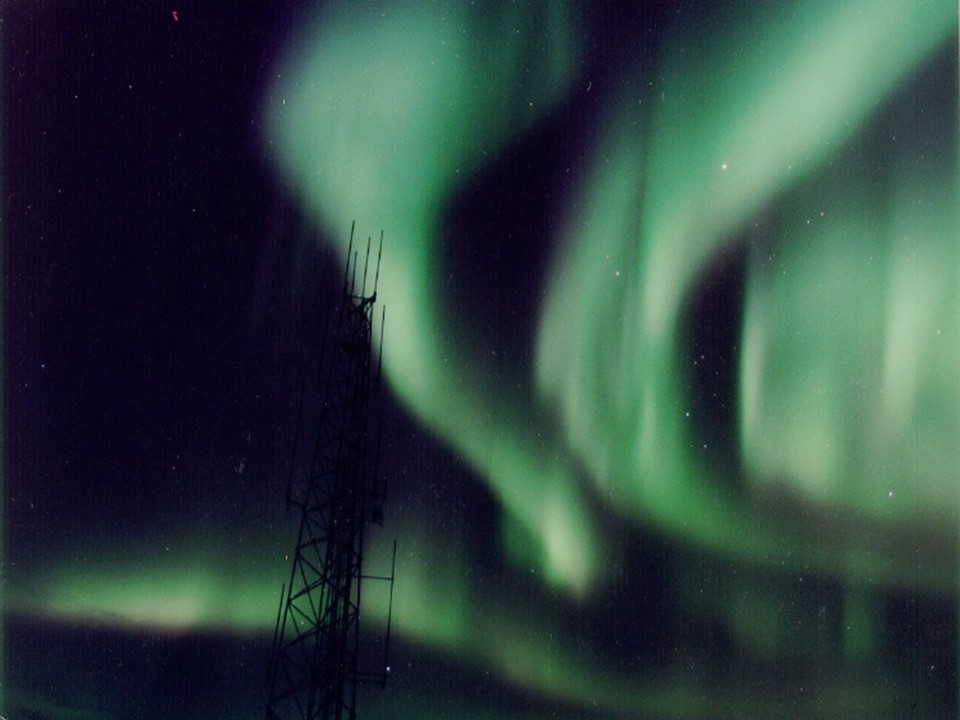
- Near Midnight: Depending on the level of geomagnetic activity, the aurora can show signs of more activity a few hours before midnight. This can be seen as waves or ripples in the auroral arcs much like someone running their hand along a curtain. The waves appear to travel along the arcs. During periods of moderate to high geomagnetic activity, there can be a series of geomagnetic substorms that greatly enhance the complexity and brightness of the aurora for several hours near midnight. The aurora can rapidly expand equatorward (southward if you are in the northern hemisphere). Great swirls and bright features appear. Each substorm is associated with a “Westward Traveling Surge” or wave of auroral activity moving westward across the sky.
The figure below shows the sky filled with aurora typical of what might be observed around midnight.
- Morning: As the substorms pass overhead and the local time progresses an hour or two past midnight, the aurora will become less active and more diffuse and “patchy” The patches of aurora often pulse on and off within an approximately 10 second period. This diffuse pulsating aurora usually continues until dawn. Diffuse aurora is not very exciting to look at. The patches are not as bright as the tall arcs and rays of the midnight aurora. The 10 second period is not fast enough to create the sense of a pulsating patch. Time-lapse video of the patches is a good way to capture the pulses.
The video below shows a fish-eye or all-sky view of patchy or pulsating aurora taken from the Poker Flat Research Range near Fairbanks Alaska. This video is courtesy of the Geophysical Institute at the University of Alaska Fairbanks.
When geomagnetic activity is very active (Kp = 8 or 9), the aurora goes through a similar progression; however, the activity is no longer limited to the few hours around midnight. The most active part of the auroral oval expands into the evening and morning sectors and bright active auroras can be seen nearly all night long.
The video below shows what active aurora looks like in real time. This video is unique in that it is not a time-laps but is showing the true nature and motions of the aurora. It also shows the true colors of the aurora and their spatial and temporal relationship to each other. It is possible to distinguish the prompt purple nitrogen emission along the lower edge of the aurora from the longer lived green atomic oxygen emission higher up in the atmosphere. This video is courtesy of the Family of Neal Brown.
Forecasting the Aurora: Forecasting the aurora on different time scales can be done in different ways.
- 15-45 Minutes: By measuring the solar wind and interplanetary magnetic field upstream of Earth it is possible to forecast the aurora quite accurately but only with a short lead time of 15-45 minutes. There is a location about 1.5 million km (1 million miles) from Earth towards the sun where gravitational forces and centripetal forces balance and satellites can remain almost stationary without expending fuel to stay in place. This location is called the 1st Lagrange orbital location (L1). This location is upstream of Earth in the solar wind. There are several satellites at this L1 location that provide measurements of the density, velocity, and magnetic field of the solar wind. These measurements provide a very accurate prediction of what the solar wind will be like a few tens of minutes later near Earth. These measurements provide a capability for accurate, short term aurora forecasts.
- Hours to Days: It is possible to predict geomagnetic activity and aurora a day or so in advance by detecting solar coronal holes on the sun and Coronal Mass Ejections (CME) near the sun. as these coronal holes or CMES leave the sun, it is possible to predict their path to determine if they will impact Earth. This technique is more challenging and the accuracy of these medium range forecasts is not as good. It is often difficult to predict which direction the CME is going and how fast it is traveling. And knowledge of the strength and direction of the magnetic field within the CME introduces a big uncertainty in how strong the geomagnetic storm will be.. The primary sensor used for CME prediction is the Solar Coronagraph which measures the outflow of solar wind close to the sun. But the coronagraphs cannot measure the magnetic field within the CME. Measurements of coronal holes are made by solar imagers such as the SUVI instrument on the NOAA GOES satellite.
- 27 Days: Active regions and Coronal Holes can last for many months and as the sun rotates, these active regions will repeatedly be directed towards Earth. They often produce similar levels of activity from one solar rotation the next. So if there was geomagnetic activity and aurora 27 days ago, there is a good chance that there will be aurora today… plus or minus a day or two.
- Years: Solar activity waxes and wanes on an approximate 11-year cycle. Thus, geomagnetic activity and aurora also follow an approximate 11 year cycle. During the 4-5 years near solar maximum, there are more solar active regions, larger solar flares, and larger and faster CMEs. However, there are some caveats to this 11 year forecast. Big solar cycles (with lots of sunspots) tend to produce more active regions and thus more auroral activity. The biggest solar flares and CME’s often occur near the end of the solar maximum period as the solar activity starts to wane. And even during solar minimum, the high speed solar wind streams from coronal holes can produce moderate geomagnetic activity (up to a Kp of 7) and thus, moderate auroral activity.
Additional Resources: