

|
Tonight's Aurora Viewline 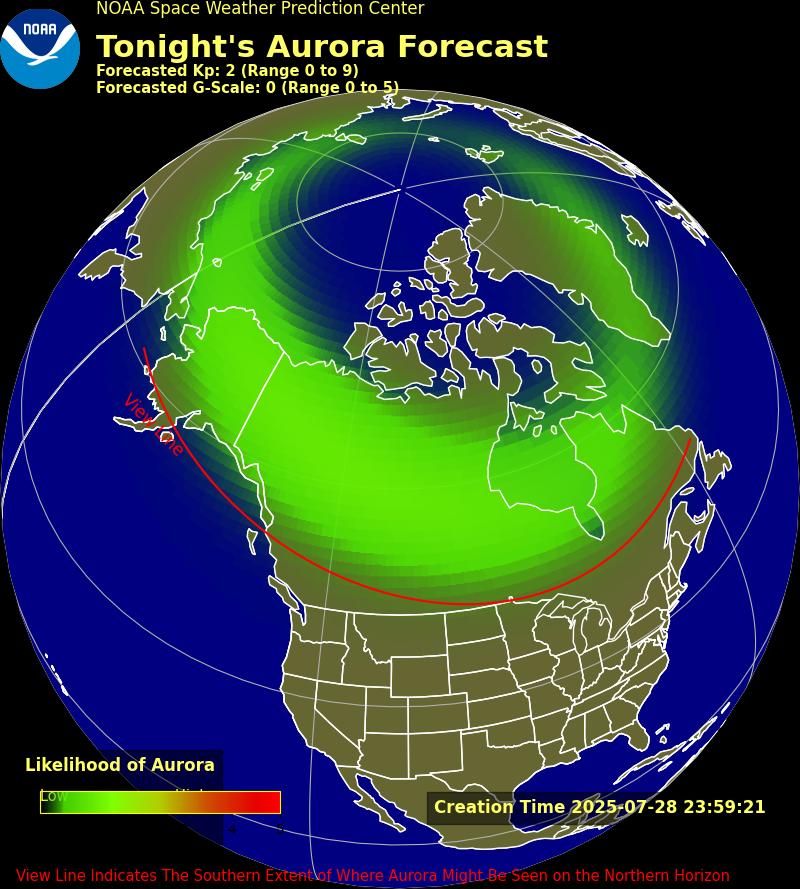
|
Tomorrow Night's Aurora Viewline 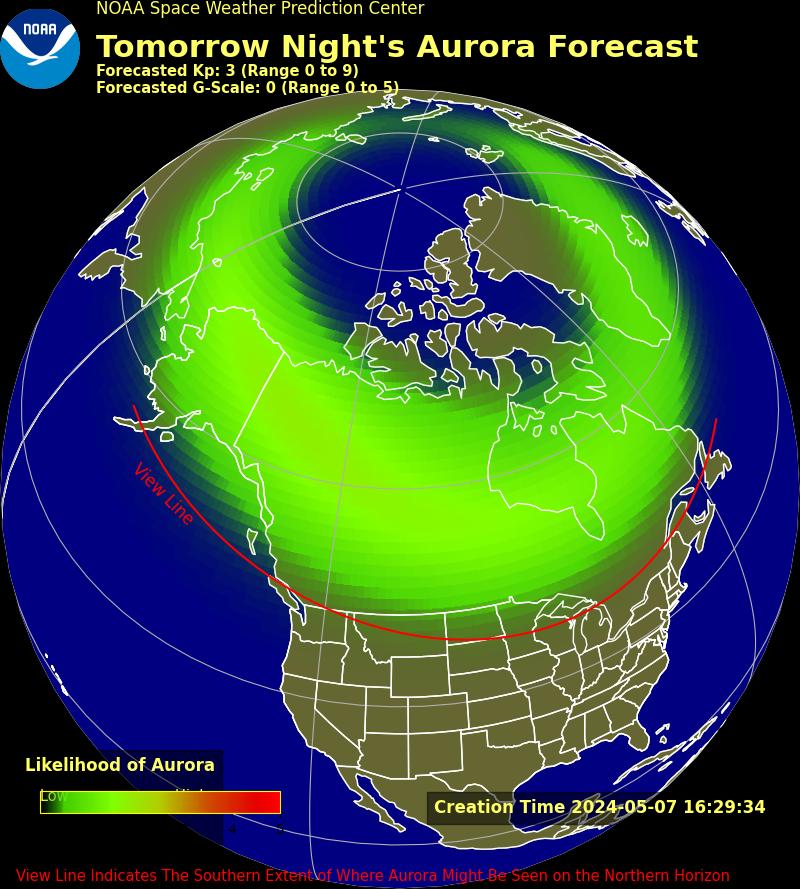
|
This is a prediction of the intensity and location of the aurora borealis tonight and tomorrow night over North America. It also shows a 'viewline' that represents the southern-most locations from which you may see the aurora on the northern horizon. This product is based on the OVATION model and uses the maximum forecast geomagnetic activity (Kp) between 6pm and 6am US Central Time. The images are updated continuously, with the transition when "tomorrow night" becomes "tonight" occurring at 12:00Z (i.e., within an hour of the end of the 6pm-6am Central Time window that is used here to define "night").
The two maps show the aurora and viewline tonight and tomorrow night. The brightness and location of the aurora is typically shown as a green oval centered on Earth’s magnetic pole. The green ovals turn red when the aurora is forecast to be more intense. Aurora can often be observed somewhere on Earth from just after sunset or just before sunrise. The aurora is not visible during daylight hours. The aurora does not need to be directly overhead but can be observed from as much as 1000 km away when the aurora is bright and if conditions are right.
A short term forecast (~30 minutes) along with the last 24 hours of activity can be found on the Aurora - 30 Minute Forecast page. And SWPC's new Aurora Dashboard (Experimental) collects the products and information from across SWPC's website for a one-stop shop.
The OVATION (Oval Variation, Assessment, Tracking, Intensity, and Online Nowcasting) model is an empirical model of the intensity of the aurora developed at the Johns Hopkins University, Applied Physics Laboratory by Patrick Newell and co-workers[1]. For tonight's and tomorrow night's aurora viewline prediction the SWPC 3-Day Geomagnetic Forecast (Kp index) is used to drive the OVATION model. The model uses maximum forecast geomagnetic activity (Kp) between 6pm and 6am US Central Time tonight and tomorrow night
For more information on the OVATION model and aurora products, see:
- Newell, P. T., T. Sotirelis, and S. Wing (2009), Diffuse, monoenergetic, and broadband aurora: The global precipitation budget, J. Geophys. Res., 114, A09207, doi:10.1029/2009JA014326(link is external).
- Machol, J. L., Green., J. C., Redmon, R. J., Viereck, R. A., Newell, P. T., (2012), Evaluation of OVATION Prime as a forecast model for visible aurorae, Space Weather, 10, 3, doi.org/10.1029/2011SW000746
In 2022, the view-line product presented here for tonight's and tomorrow night's aurora first debuted.
The history of the OVATION model can be found on the 'History' tab of the Aurora - 30 Minute Forecast page.
Because the view-line images are based on forecast Kp, the images themselves are not archived.