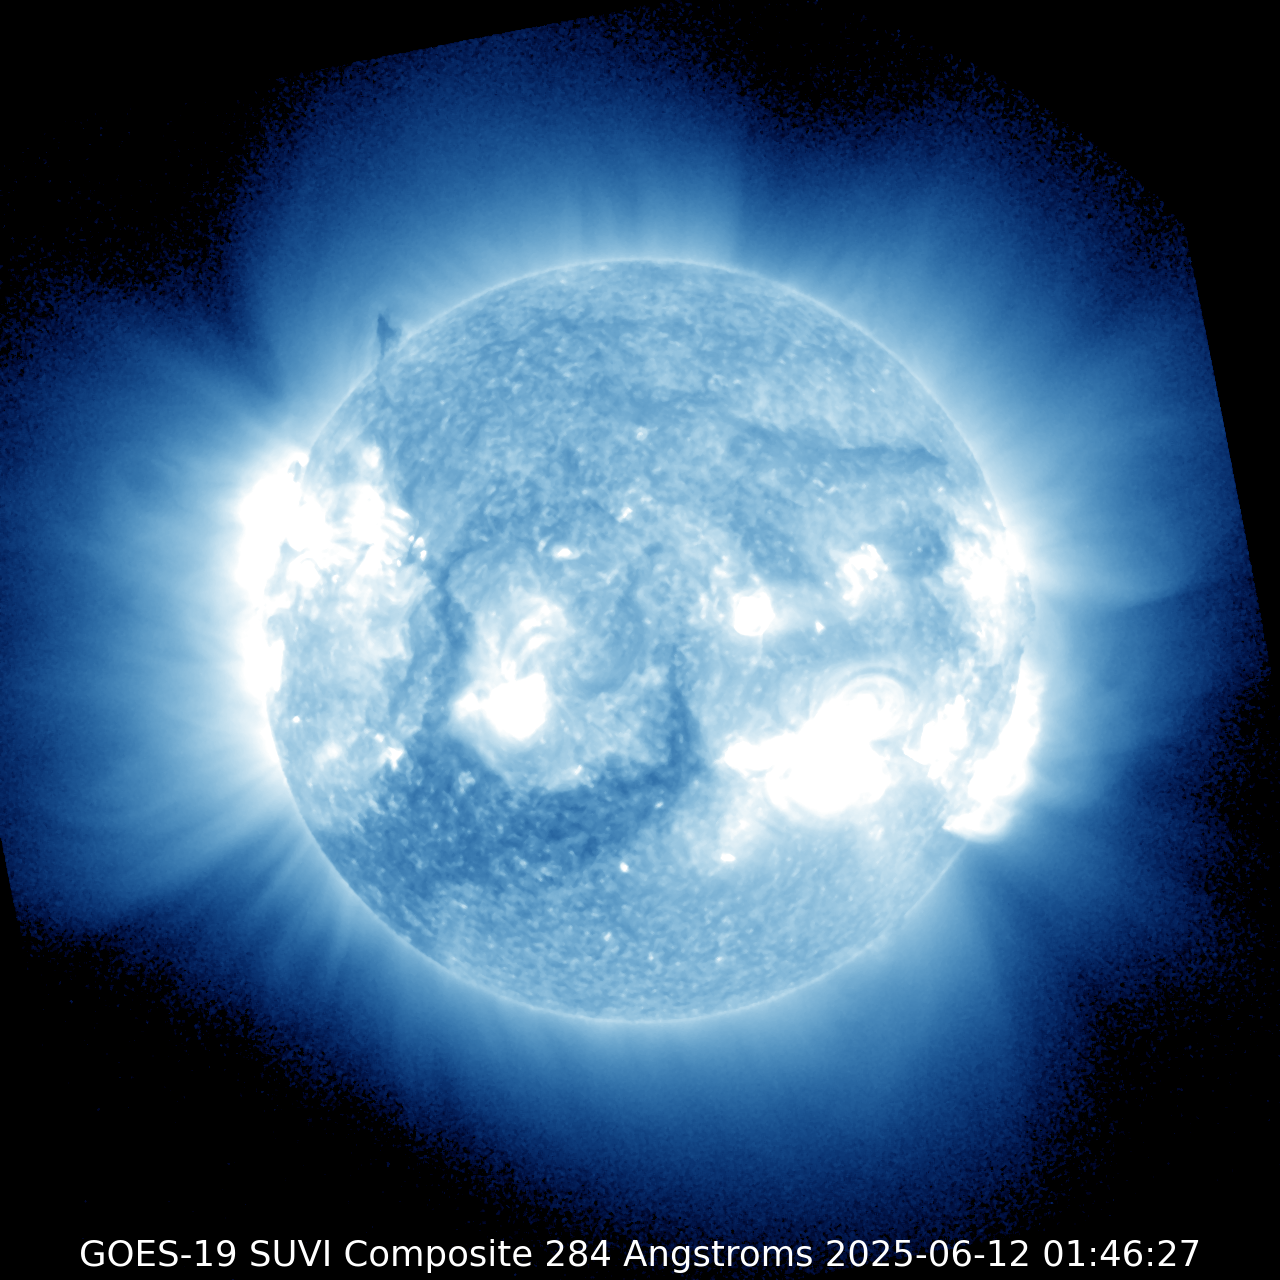
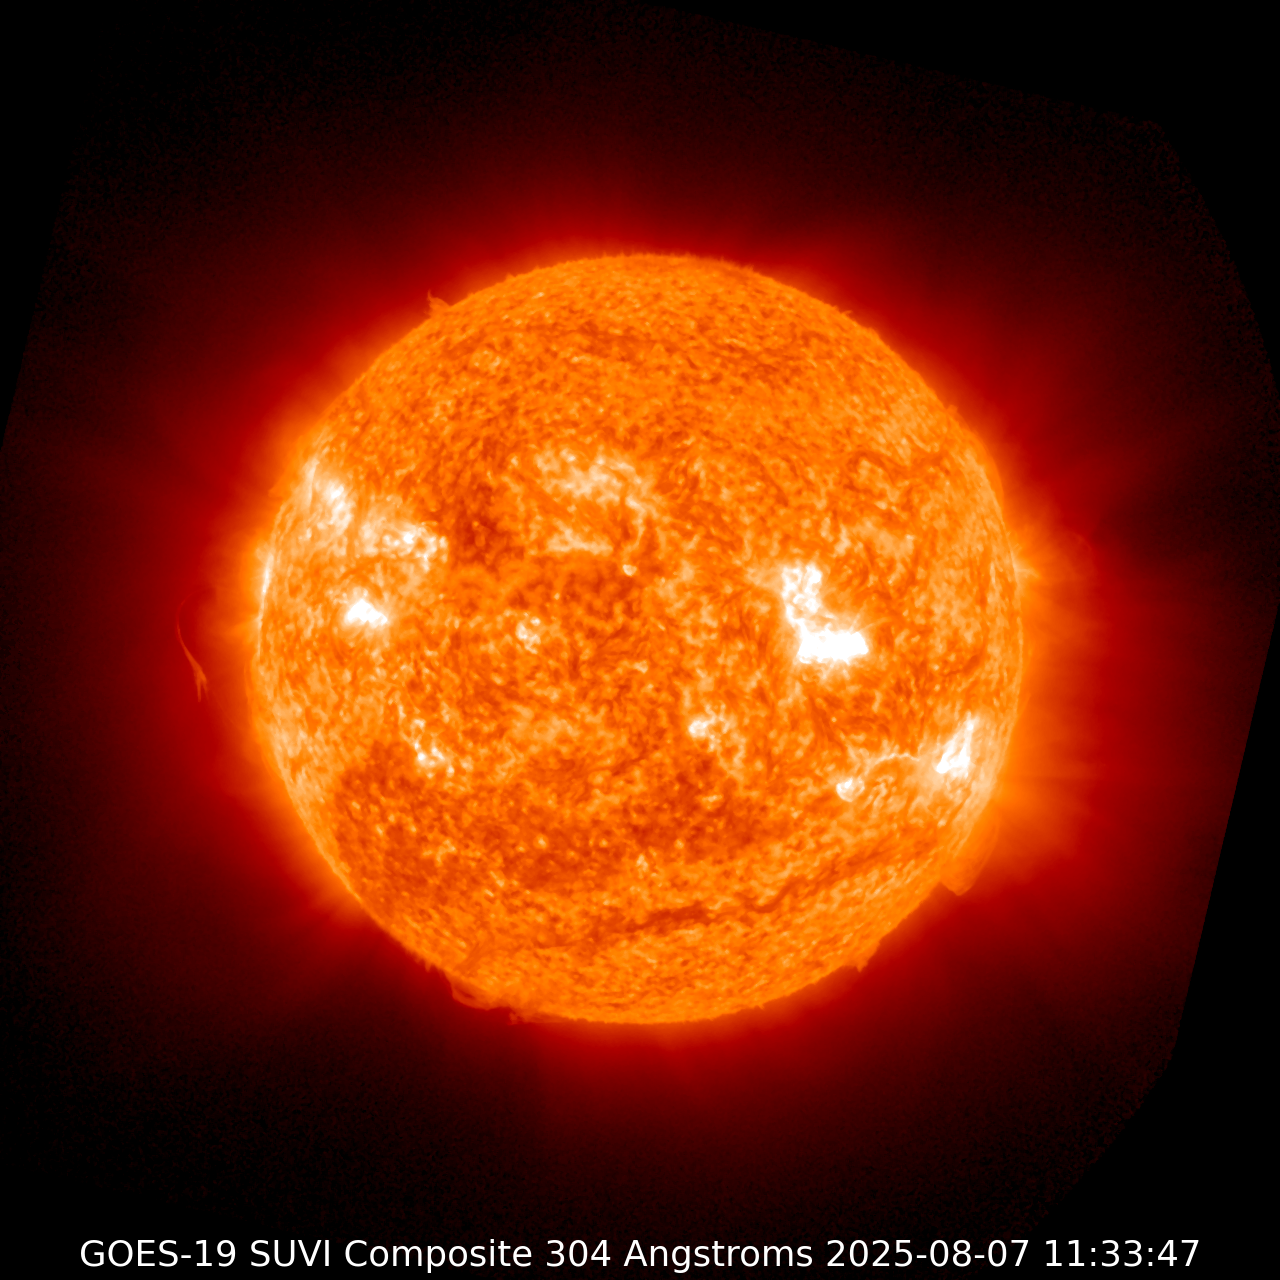
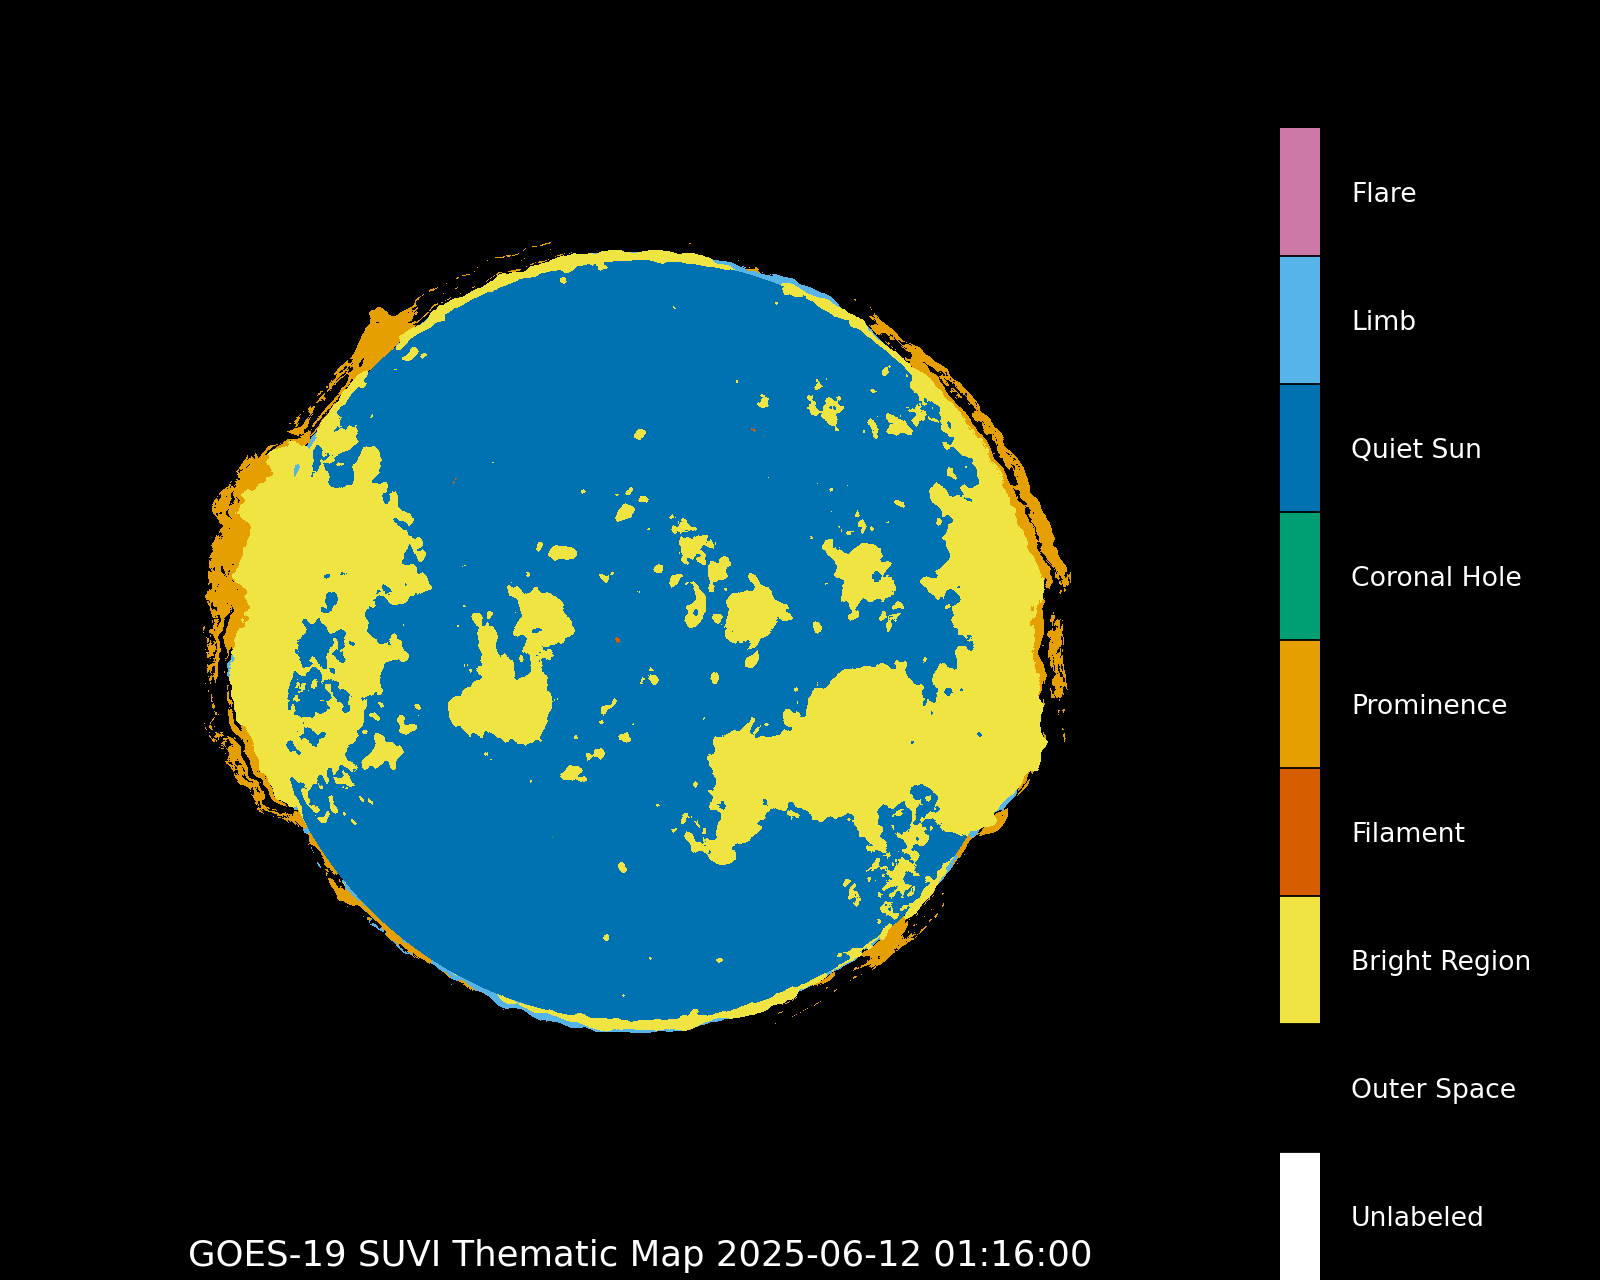
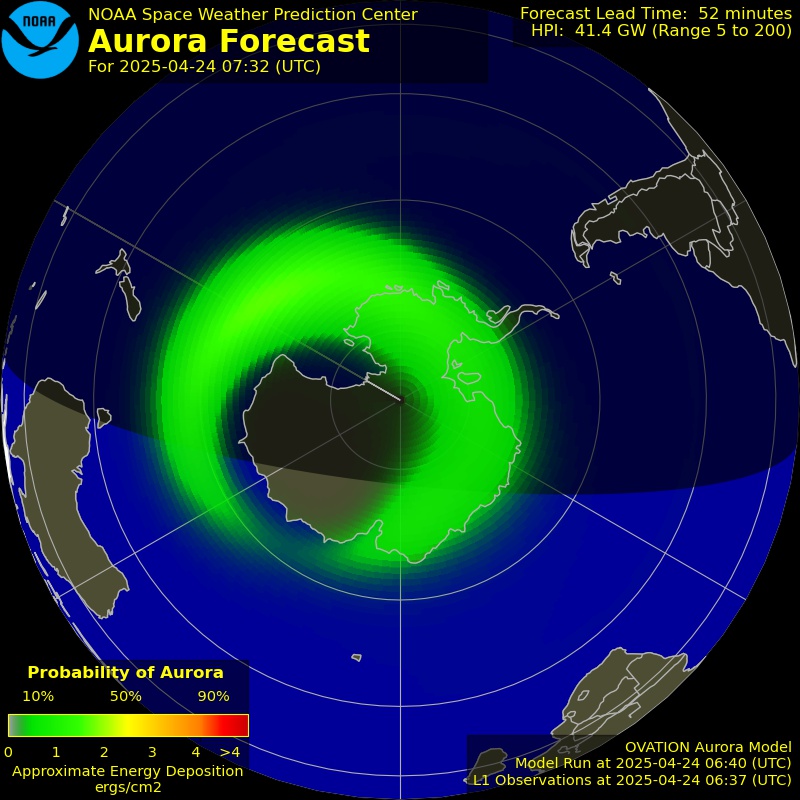
NOAA Logo

NWS Logo

Organizations

Space Weather Prediction Center

National Oceanic and Atmospheric Administration

Friday, April 11, 2025 15:24:57 UTC

Main menu

NOAA Scales

minimize icon
Space Weather Conditions
24-Hour Observed Maximums
R
none
S
none
G
none
Latest Observed
R
none
S
none
G
none
Predicted 2025-04-11 UTC
R1-R2 45%
R3-R5 5%
S1 or greater 1%
G
none
Predicted 2025-04-12 UTC
R1-R2 45%
R3-R5 5%
S1 or greater 1%
G1
minor
Predicted 2025-04-13 UTC
R1-R2 45%
R3-R5 5%
S1 or greater 1%
G
none
maximize icon
R
none
S
none
G
none
Current Space Weather Conditions
R1 (Minor) Radio Blackout Impacts
close
HF Radio: Weak or minor degradation of HF radio communication on sunlit side, occasional loss of radio contact.
Navigation: Low-frequency navigation signals degraded for brief intervals.
More about the NOAA Space Weather Scales

Space Weather Summary

  • Solar Wind Speed: 446 km/sec
  • Solar Wind Magnetic Fields: Bt 7 nT, Bz 5 nT
  • Noon 10.7cm Radio Flux: 153 sfu

Slider

New Coronagraph Page Available
New Solar Cycle Plots Available!
NOAA Safeguards Satellites!
Tuesday, April 08, 2025 16:07 UTC

SWPC is excited to announce an improvement to the coronagraph imagery available on our webpage.

Monday, March 31, 2025 20:30 UTC

These new solar cycle plots will provide more accurate predictions for solar cycle 25 (SC25).

Wednesday, March 19, 2025 20:16 UTC

Since February 25, 2025, the Space Weather Prediction Center has presented new coronagraph images and data from the GOES-19 Compact Coronagraph-1 (CCOR-1). 

Friday, February 21, 2025 16:43 UTC

Read the full story here

Serving Essential Space Weather Communities

The Sun (EUV)

Solar Ultraviolet Image

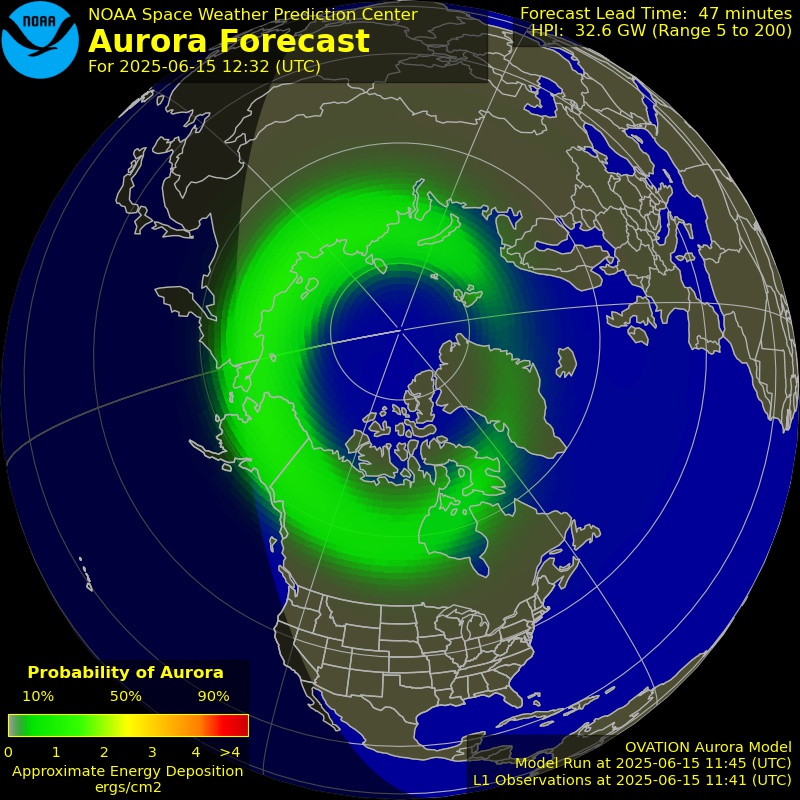
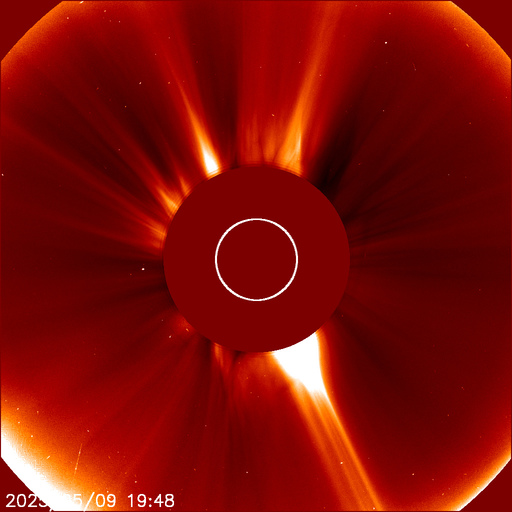
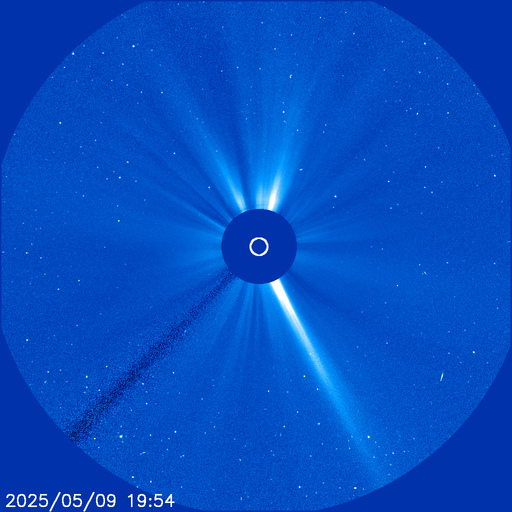
Coronal Mass Ejections
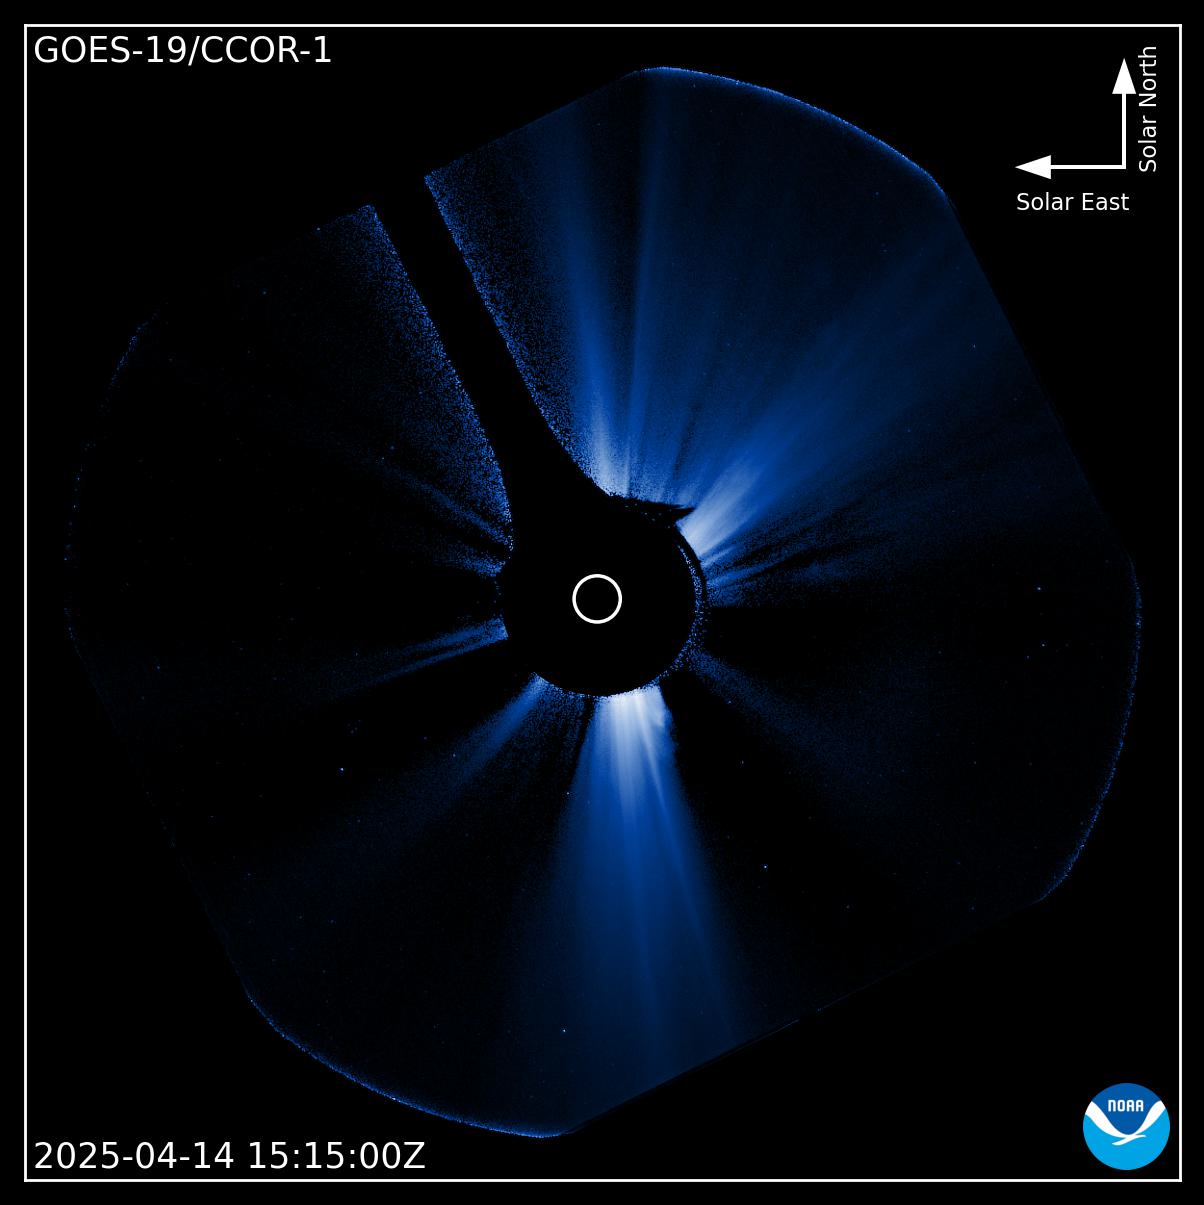
LASCO C3 Coronagraph Image

The Aurora

Aurora ovation plot

GOES X-Ray Flux

Created with Highcharts 8.0.4SWPC Warning ThresholdABCMXChart context menuUpdated 2025-04-1115:21 UTCZoom6 Hour1 Day3 Day7 DayApr 10Apr 12

GOES Proton Flux

Created with Highcharts 8.0.4SWPC 10 MeV Warning ThresholdChart context menuUpdated 2025-04-1115:15 UTCZoom6 Hour1 Day3 Day7 DayApr 10Apr 12
Created with Highcharts 8.0.4Universal TimeKp indexChart context menuEstimated Planetary K index (3 hour data)Apr 9Apr 10Apr 1103:0006:0009:0012:0015:0018:0021:0003:0006:0009:0012:0015:0018:0021:0003:0006:0009:0012:0015:0018:0021:00Apr 1201234567890123456789Space Weather Prediction CenterBegin: Wed, 09 Apr 2025 00:00:00 GMT
Updated Time: 2025-04-11T12:00:00.000Z
NOAA Scales Geomagnetic Storms
Kp < 5 Kp = 5 (G1) Kp = 6 (G2) Kp = 7 (G3) Kp = 8, 9- (G4) Kp = 9o (G5)